 Rohan Verma
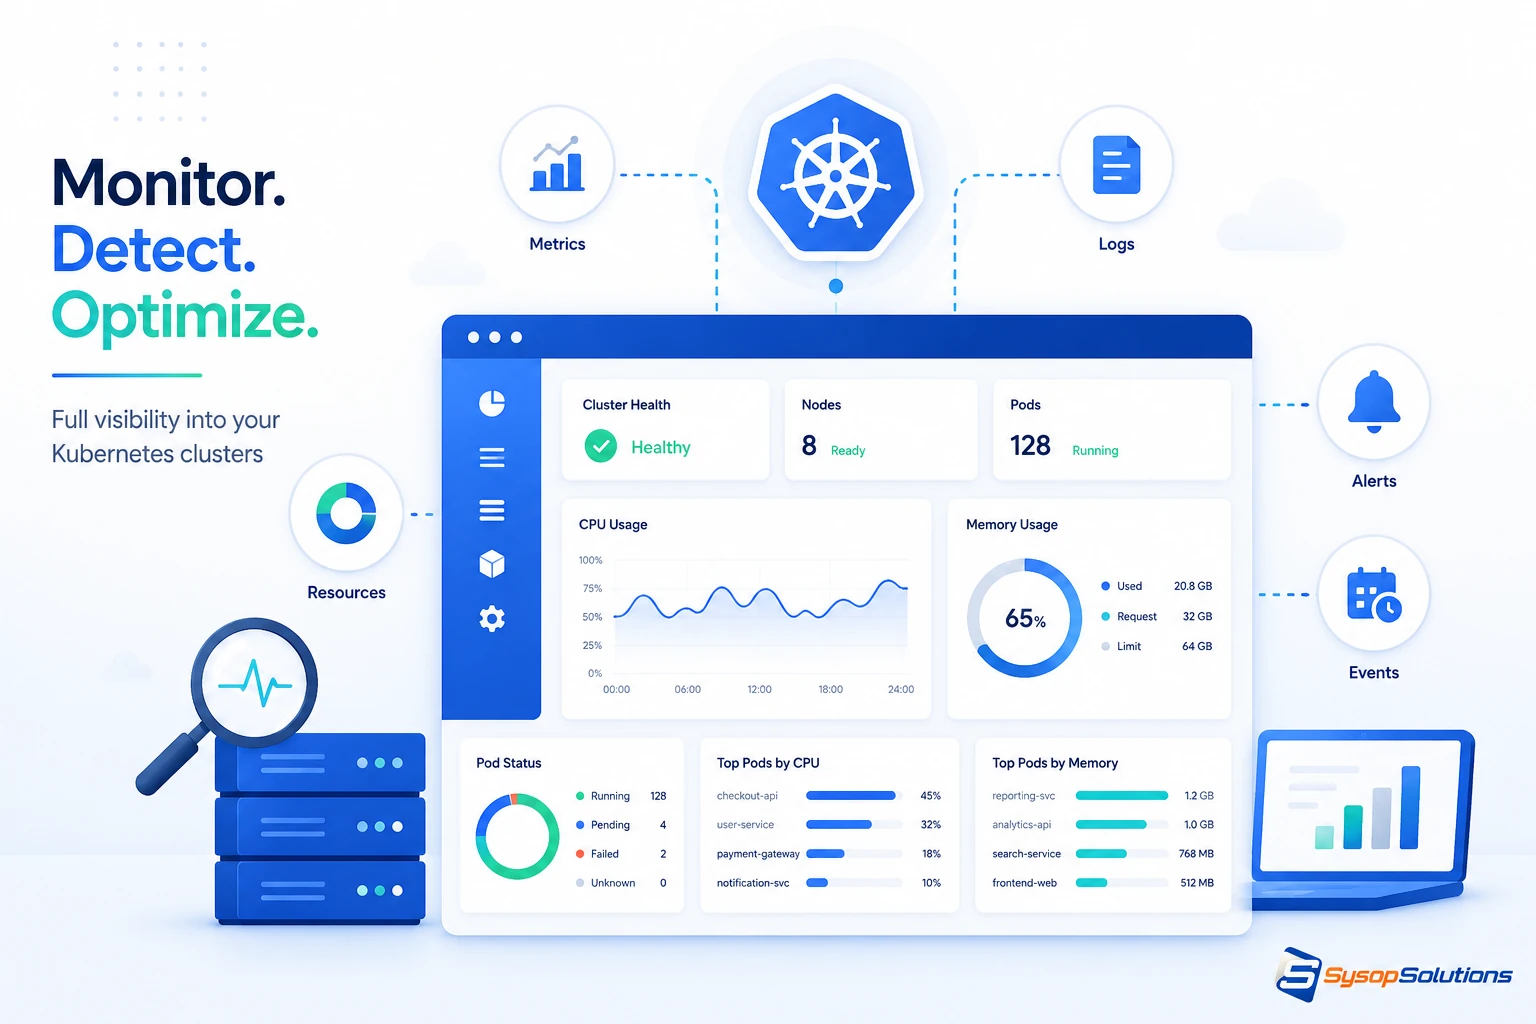
Kubernetes clusters can look healthy in kubectl right up until they aren't. Here's what to actually monitor — cluster, workload, control plane, and etcd — and where most setups leave blind spots.
A Kubernetes cluster can be running "fine" from kubectl get pods and still be minutes away from a cascading failure — a memory leak slowly eating a node, a misconfigured resource limit about to trigger an OOM kill, a PVC quietly filling up. Kubernetes is built to self-heal in a lot of scenarios, and that's exactly what makes bad monitoring dangerous: the cluster keeps rescheduling pods and restarting containers right up until it can't, and by then you're debugging a production incident instead of reading an alert that fired an hour earlier.
This matters more now than it did a few years ago because clusters have gotten more complex — more microservices, more namespaces, more autoscaling logic making decisions on your behalf. Monitoring Kubernetes clusters properly isn't optional infrastructure hygiene anymore; it's the difference between catching a resource exhaustion issue at 2% utilization headroom and catching it after your API starts timing out. This guide covers what actually needs monitoring, the tools that do it well, and the mistakes that leave teams flying blind despite having a monitoring stack technically "installed."
## What Kubernetes Monitoring Actually Covers
Kubernetes monitoring operates at several distinct layers, and a lot of setups only cover one or two of them:
- Cluster-level health — node status, control plane component health (API server, scheduler, etcd), and overall resource capacity.
- Workload-level metrics — pod CPU/memory usage against requests and limits, restart counts, pending/failed pod states.
- Application-level metrics — request latency, error rates, throughput from the applications actually running inside the cluster.
- Networking — service mesh health if you're running one, ingress controller performance, DNS resolution failures within the cluster.
- etcd performance — often ignored, but etcd is the cluster's source of truth, and degraded etcd performance degrades everything scheduled on top of it.
The mistake we see most often: teams monitor pod-level CPU and memory (because it's the easiest thing to graph) and stop there, missing control plane health and etcd performance entirely — which are exactly the components whose failure takes down the whole cluster, not just one workload.
[Internal Link: Understanding Kubernetes Resource Requests and Limits]
## Key Monitoring Components and Real-World Impact
- Prometheus — the de facto standard for Kubernetes metrics collection, pulling time-series data from cluster components and workloads via exporters and the /metrics endpoints most Kubernetes-native tools expose by default.
- Grafana — visualization layer on top of Prometheus data; the actual dashboards your team looks at during an incident, not just raw metrics in a query language.
- kube-state-metrics — exposes Kubernetes object state (deployments, replicasets, pod status) as metrics, which is different from and complementary to resource usage metrics — this is what tells you a deployment has pods stuck in Pending for 20 minutes, not just that CPU is high somewhere.
- Node exporter — surfaces host-level metrics (disk I/O, network, filesystem usage) that Kubernetes-native metrics alone don't capture, and that matter a lot when a node-level issue is the actual root cause of pod instability.
- Alertmanager — routes alerts from Prometheus to the right channel (Slack, PagerDuty, email) with deduplication and grouping, so one underlying issue doesn't generate fifty separate pages.
- Distributed tracing (Jaeger/Tempo) — for microservice architectures, tracing shows you where a slow request actually spent its time across service boundaries, which raw metrics can't answer on their own.
Real-world impact example: a team running an e-commerce API on Kubernetes noticed intermittent 502 errors during traffic spikes. Pod-level metrics looked normal — CPU and memory were within limits. The actual cause, visible only in node-level and etcd metrics, was API server request latency spiking under load because etcd was under-provisioned for the write volume during traffic bursts. Without etcd-specific monitoring, that root cause would have stayed invisible indefinitely.
## Common Problems Businesses Face
Alert fatigue from poorly tuned thresholds. Default alerting rules from most Helm charts fire too aggressively out of the box, and teams either drown in noise or disable alerts entirely after a few weeks of pager fatigue — at which point you have monitoring infrastructure generating data nobody actually looks at.
Missing resource request/limit configuration. Pods without defined resource requests and limits make cluster-level monitoring far less useful, because the scheduler and the metrics stack both lose a baseline to measure against. This also directly causes noisy-neighbor problems where one misbehaving pod starves others on the same node.
No visibility into etcd and control plane health. As covered above, this is the layer most commonly skipped, and it's the layer whose degradation affects the entire cluster rather than a single workload.
Metrics retention gaps. Default Prometheus retention is often set too short to do meaningful trend analysis or post-incident review, and teams don't discover this until they need three-week-old data during a postmortem and it's already gone.
Dashboard sprawl without ownership. Clusters accumulate dozens of Grafana dashboards over time, many outdated or duplicated, with no clear "this is the one to check during an incident" designation — which slows down response when it matters most.
[Internal Link: Setting Resource Requests and Limits Correctly in Kubernetes]
## Best Practices for Monitoring Kubernetes Clusters
- Instrument all four layers — cluster, workload, application, and networking — rather than stopping at whichever is easiest to set up first.
- Set resource requests and limits on every workload, not just the ones that have caused problems before; this is the foundation that makes utilization metrics meaningful.
- Tune alert thresholds to your actual traffic patterns, not the defaults shipped with your monitoring stack's Helm chart — a threshold appropriate for a low-traffic internal tool will fire constantly on a high-traffic public API.
- Monitor etcd explicitly: disk latency, database size, and leader election frequency are the metrics that catch control-plane degradation before it becomes an outage.
- Set meaningful metrics retention — 30-90 days minimum for trend analysis, longer if compliance or capacity planning requires historical data.
- Designate a single "incident dashboard" per cluster with the handful of metrics that actually matter during an outage, separate from the deeper exploratory dashboards used for capacity planning.
- Alert on symptoms your users would notice (elevated error rate, latency) in addition to infrastructure metrics — infrastructure can look fine while the actual user-facing experience degrades.
[Internal Link: Configuring Alertmanager for Kubernetes Incident Response]
## How Sysop Solutions Helps
Monitoring a Kubernetes cluster properly requires the same underlying discipline as everything else we do at Sysop Solutions: real infrastructure expertise, not a dashboard bolted on after the fact. We work directly with teams running Kubernetes on our infrastructure to set up Prometheus and Grafana stacks configured against your actual workload patterns — not default thresholds copied from a tutorial.
That includes the parts most managed Kubernetes offerings abstract away and, in doing so, leave you blind to: etcd performance, node-level resource contention, and control plane health. Because we operate at the Linux and infrastructure layer directly, we can correlate what you're seeing in Kubernetes metrics with what's actually happening on the underlying nodes — disk I/O, network throughput, kernel-level resource limits — instead of treating the cluster as a black box sitting on top of servers nobody's watching.
For teams running Kubernetes alongside other infrastructure — VPS-hosted databases, Coolify deployments, cPanel-managed legacy systems — we bring the same hands-on ops approach across your whole stack, so your Kubernetes monitoring isn't an isolated silo disconnected from everything else you're running.
[Internal Link: Kubernetes Hosting and Infrastructure Support at Sysop Solutions]
## Real Business Benefits
Properly monitored Kubernetes clusters catch problems while they're still cheap to fix. Resource exhaustion caught at 70% utilization is a scaling conversation; the same issue caught at 100% utilization during a traffic spike is a customer-facing outage. The cost difference between those two scenarios isn't linear — it's the difference between a planned change and an emergency response involving multiple engineers and lost revenue during downtime.
Good monitoring also directly reduces mean time to resolution (MTTR) during incidents that do happen. A team with etcd metrics, node-level visibility, and a well-tuned incident dashboard can go from "something's wrong" to "here's the root cause" in minutes rather than hours of manual kubectl investigation across dozens of pods and namespaces. That speed matters disproportionately during customer-facing outages, where every additional minute of downtime has a real, measurable cost.
## Conclusion
Monitoring Kubernetes clusters properly means going beyond pod-level CPU and memory graphs to cover cluster health, control plane and etcd performance, application-level metrics, and networking — with alert thresholds tuned to your actual traffic, not generic defaults. The teams that get burned by Kubernetes incidents are almost always missing one of these layers, usually etcd or control plane visibility, not because it's hard to monitor but because it's easy to overlook until it's the reason for an outage.
Ready to Get Real Visibility Into Your Kubernetes Infrastructure?
Sysop Solutions works directly at the infrastructure layer to set up monitoring that actually reflects how your cluster and the servers underneath it behave under real traffic. [Talk to our team](https://sysophost.com) about building a monitoring setup that catches problems before your users do.
Comments
No comments yet. Be the first to comment!