 Rohan Verma
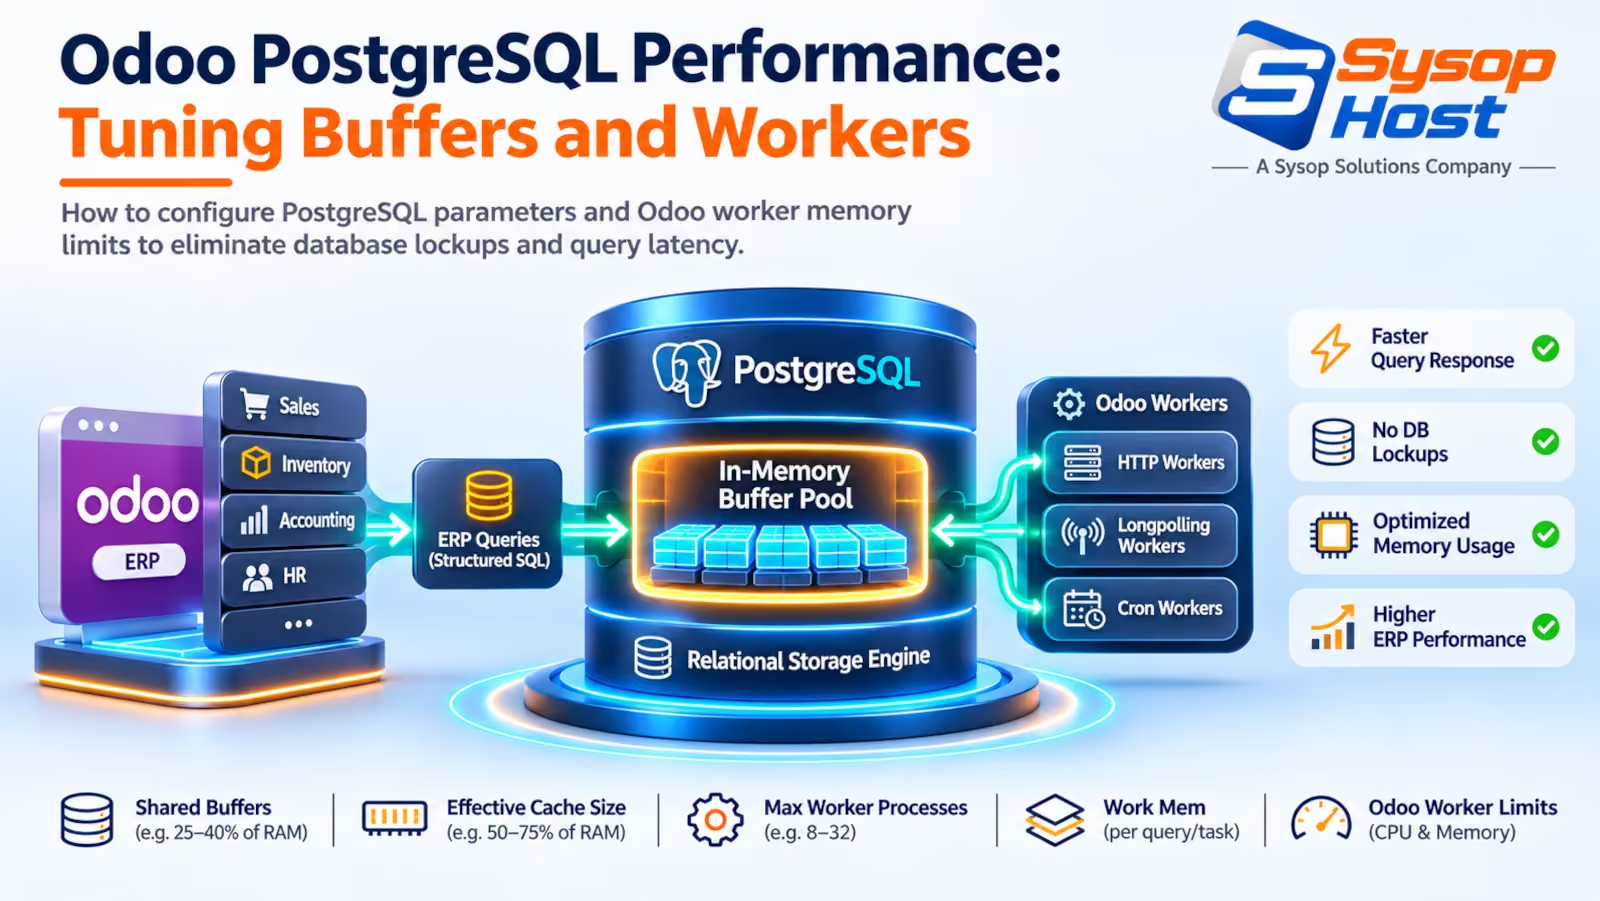
Default PostgreSQL configurations are designed for shared systems with a few hundred megabytes of RAM. When an Odoo ledger expands past five million rows, those defaults cause severe lockups during inventory recalculations and fiscal year-end closes. Learn the exact memory formulas, worker limits, and autovacuum controls that keep queries fast.
At four-thirty on the final Friday of the quarter, the finance team starts the fiscal closing run while warehouse staff scan incoming shipments for Monday dispatch. Suddenly, the user interface freezes. Loading a single journal entry takes forty seconds, delivery order validations time out with gateway errors, and the system load average climbs past fifty.
The bottleneck usually isn't Odoo's Python. The culprit is an un-tuned PostgreSQL instance running on defaults meant for a machine with two gigabytes of memory.
Everything else you tune on an Odoo host is a rounding error next to odoo postgresql performance. Odoo is an intensely transactional Object-Relational Mapping (ORM) application. Every button click, stock reservation, and invoice creation triggers multiple nested queries across relational tables with millions of rows [1].
When your database configuration leaves ninety percent of server RAM unutilized and forces active indexes onto slow disk storage, latency compounds across all users. Configuring the memory subsystem, tuning worker thresholds, and pacing maintenance daemons transforms sluggish operations into sub-second responses.
Why stock PostgreSQL defaults fail under ERP workloads
When you install PostgreSQL on Ubuntu or Debian, the configuration file postgresql.conf ships with conservative values designed to ensure the daemon boots on tiny legacy hardware:
shared_buffers = 128MBwork_mem = 4MBmax_connections = 100
In an active Odoo instance tracking five hundred thousand products and five million stock moves, a shared_buffers setting of 128 MB is disastrous. The entire active index set for tables like account_move_line, stock_quant, and mail_message cannot fit into memory.
PostgreSQL is forced to fetch index pages from physical disk on almost every query. Even on solid-state NVMe drives, disk reads are orders of magnitude slower than reading directly from CPU-adjacent RAM cache.
Database Setup | Buffer Allocation | Query Path | Typical Latency Range |
|---|---|---|---|
Stock PostgreSQL Configuration | 128 MB Shared Buffers | Physical NVMe Disk I/O (Cache Miss) | 3,000 ms - 15,000 ms |
Tuned Production Configuration | 8 GB - 16 GB Shared Buffers | Direct Memory Read (Cache Hit) | 15 ms - 50 ms |
Odoo also uses dynamic ORM queries that construct multi-table joins on the fly. When a query sorts large recordsets and work_mem is capped at 4 MB, PostgreSQL can't sort in memory. It creates temporary spill files on disk, slowing down report generation and consuming disk bandwidth.
Sizing shared buffers, work memory, and effective cache
To align PostgreSQL with dedicated server hardware, calculate settings based on total physical RAM available on your database host.
1. shared_buffers
This parameter determines how much dedicated memory PostgreSQL allocates for caching data blocks and index pages.
Recommended Formula: Set
shared_buffersto 25% of total server RAM on a dedicated database node.Why not more? Unlike some database engines, PostgreSQL does not manage all caching internally. It relies heavily on the underlying Linux page cache to hold read blocks. Setting
shared_buffershigher than 40% often degrades performance by causing double-buffering between PostgreSQL and the kernel.
On a 32 GB RAM server, assign:
shared_buffers = 8GB2. effective_cache_size
This setting does not allocate memory. It acts as an advisory metric for the query planner, estimating how much memory is available for caching in both PostgreSQL buffers and the OS page cache combined.
Recommended Formula: Set to 50% to 75% of total server RAM.
On a 32 GB server:
effective_cache_size = 24GBSetting this accurately instructs the PostgreSQL planner that indexes will reside in memory, prompting it to favor fast index scans over slow sequential table scans.
3. work_mem
This allocates memory for internal sort operations and hash tables per query operation before spilling to temporary disk files.
Recommended Formula:
'_' allowed only in math mode
$$\text{work_mem} = \frac{\text{Total RAM} \times 0.25}{\text{max_connections} \times 2}$$If your server has 32 GB of RAM and allows 100 maximum connections:
'_' allowed only in math mode
$$\text{work_mem} = \frac{8\text{ GB}}{200} = 40\text{ MB}$$work_mem = 40MB
maintenance_work_mem = 1GBRound the formula to 40 MB and stop there. Rounding up to 64 MB because it looks tidier is how 100 connections × 4 concurrent sorts turn into an OOM kill. maintenance_work_mem at 1 GB speeds up index rebuilds and VACUUM without letting a maintenance window eat your page cache.
PostgreSQL Parameter | Default Debian/Ubuntu Value | Recommended Value (32GB Host) | Performance Impact |
|---|---|---|---|
|
|
| Eliminates disk reads for hot table indexes. |
|
|
| Encourages query planner to choose index scans. |
|
|
| Prevents disk spills during large report sorting. |
|
|
| Accelerates vacuuming and index creation. |
|
|
| Tells planner disk is NVMe, not slow spinning disks. |
|
|
| Buffers transaction commit writes to WAL disk. |
For organizations evaluating whether their database sizing matches operational needs, our team provides architectural reviews through managed cloud infrastructure and database hosting comparisons.
Tuning Odoo multi-processing limits: CPU and memory caps
Tuning the database is half the equation. If Odoo's Python workers run unconstrained, memory leaks in custom third-party modules can consume all host memory, starving the database of buffer cache.
In odoo.conf, enforce strict boundaries on worker lifecycles:
[options]
; Multi-processing configuration for 8 CPU cores (17 workers total)
workers = 17
max_cron_threads = 2

; Memory limits per worker (in bytes)
; 2.5 GB soft limit: worker finishes current request then recycles
limit_memory_soft = 2684354560

; 3.0 GB hard limit: worker killed immediately if exceeded
limit_memory_hard = 3221225472

; Request lifecycle limits: prevent long-term memory fragmentation
limit_request = 8192

; Time limits (in seconds)
limit_time_cpu = 120
limit_time_real = 240
limit_time_real_cron = 600
Understanding the parameters
limit_request = 8192: Python's memory allocator rarely releases freed memory back to the operating system efficiently. Setting this limit recycles each worker process cleanly after it handles 8,192 requests, preventing memory bloat from accumulating over months.limit_memory_soft: When a worker crosses this threshold (2.5 GB), it is marked for recycling as soon as its current transaction completes.limit_memory_hard: If an un-optimized custom script attempts to load an entire 500,000-record partner table into memory, the worker is terminated immediately before it triggers a system-wide kernel panic.limit_time_cpu = 120: Kills any runaway calculation looping past two minutes of CPU time.
Allocating sufficient hardware resources on dedicated cloud hosting ensures that these safety thresholds are rarely triggered during normal operations.
Taming autovacuum on high-churn tracking and ledger tables
PostgreSQL uses Multi-Version Concurrency Control (MVCC). When a record is updated or deleted (such as updating stock quantities or adding a log message to an invoice chatter), PostgreSQL does not overwrite the existing row. It marks the old row as dead and inserts a new one.
The autovacuum daemon is responsible for reclaiming that space. If autovacuum cannot keep up with high transaction rates, tables suffer severe "table bloat". Indexes balloon in size, queries slow down, and disk space evaporates.
By default, autovacuum wakes up too infrequently for high-velocity ERP databases.
Add these custom autovacuum rules in postgresql.conf:
# Aggressive autovacuum scheduling for high-write ERP databases
autovacuum = on
autovacuum_max_workers = 4
autovacuum_naptime = 15s

# Trigger vacuum when 5% of table rows change (down from default 20%)
autovacuum_vacuum_scale_factor = 0.05
autovacuum_analyze_scale_factor = 0.02

# Reduce I/O throttling during vacuum cycles
autovacuum_vacuum_cost_limit = 1000
autovacuum_vacuum_cost_delay = 2ms
Table-specific autovacuum tuning
In Odoo, three specific tables generate the vast majority of dead tuples:
mail_message: Stores all chatter notes, system notifications, and emails.bus_presence: Manages real-time user status and websocket polling.stock_quant: Tracks real-time inventory balances across warehouse bins.
Apply specific autovacuum parameters directly to these tables in SQL:
-- Tune high-churn tables to vacuum after every 5,000 row modifications
ALTER TABLE mail_message SET (
    autovacuum_vacuum_scale_factor = 0.0,
    autovacuum_vacuum_threshold = 5000
);

ALTER TABLE bus_presence SET (
    autovacuum_vacuum_scale_factor = 0.0,
    autovacuum_vacuum_threshold = 2000
);
This prevents massive bloat waves that lock read queries during peak business hours [2].
Diagnosing slow queries: index bloat and pg_stat_statements
You can't optimize what you don't measure. Standard Odoo logs output query execution durations, but analyzing thousands of lines of text logs is impractical during an incident.
Enable the PostgreSQL extension pg_stat_statements to track query performance directly in SQL:
# Add to postgresql.conf
shared_preload_libraries = 'pg_stat_statements'
pg_stat_statements.track = all
pg_stat_statements.max = 10000
After restarting PostgreSQL, execute CREATE EXTENSION pg_stat_statements; inside your Odoo database.
Identifying the top query offenders
Run this diagnostic query to find the statements consuming the most cumulative database time:
SELECT
    round((total_exec_time / 1000 / 60)::numeric, 2) AS total_minutes,
    calls,
    round((mean_exec_time)::numeric, 2) AS mean_ms,
    substring(query, 1, 80) AS short_query
FROM pg_stat_statements
ORDER BY total_exec_time DESC
LIMIT 5;
If you see queries against custom tables where calls is high and mean_ms exceeds 200 ms, inspect those models. Developers frequently forget to add index=True on relational fields (Many2one) in custom modules, forcing PostgreSQL to perform sequential scans across millions of rows on every join.
To maintain real-time visibility into query execution spikes and hardware saturation, implementing continuous infrastructure monitoring prevents small index regressions from turning into operational outages.
Connection pooling with PgBouncer: preventing connection spikes
Each worker process in Odoo opens its own persistent connection to PostgreSQL. If you configure 16 web workers and 2 cron workers, Odoo maintains at least 18 connections.
In multi-tenant configurations or environments with multiple application containers, connection counts can spike past 300 during marketing campaigns. Each PostgreSQL connection consumes approximately 10 MB of memory purely for session state, leading to thread contention on the CPU.
Deploying PgBouncer in front of PostgreSQL provides lightweight connection pooling:
; /etc/pgbouncer/pgbouncer.ini
[databases]
odoo_production = host=127.0.0.1 port=5432 dbname=odoo_production

[pgbouncer]
listen_addr = 127.0.0.1
listen_port = 6432
auth_type = scram-sha-256
auth_file = /etc/pgbouncer/userlist.txt

; Session pooling is the safe default. Transaction pooling packs better,
; but it breaks anything that keeps session state (advisory locks, SET,
; prepared statements), so verify your addons before switching.
pool_mode = session
max_client_conn = 500
default_pool_size = 30
min_pool_size = 10
reserve_pool_size = 5
Client Traffic Spike (250 Incoming Connections)
│
▼
┌──────────────────────────────────────────────┐
│ PgBouncer Connection Pool │
│ - Holds 250 active client connections │
│ - Multiplexes into 30 persistent channels │
└─────────────────────┬────────────────────────┘
│ (Only 30 Server Connections)
▼
┌──────────────────────────────────────────────┐
│ PostgreSQL Database Engine │
│ - Low context switching │
│ - Low RAM overhead per connection │
└──────────────────────────────────────────────┘
Session versus transaction pooling
Under pool_mode = transaction, PgBouncer assigns a server connection to an Odoo worker only while an active SQL transaction is running. As soon as the transaction commits, the connection returns to the pool. Under session, the worker keeps that backend connection until it disconnects.
That allows three hundred application workers to share thirty physical PostgreSQL connections. It also breaks any feature that assumes it owns the connection: session-scoped advisory locks, SET that survives the statement, and prepared statements across transactions. Odoo core is mostly fine, third-party addons are not always. Start in session mode, measure, and move to transaction only after the addon audit.
Accelerate your ERP database on enterprise infrastructure
SysopHost provides dedicated NVMe servers, managed PostgreSQL instances, and 24/7 engineer support to ensure your Odoo ERP delivers sub-second response times during peak accounting runs.
Explore Managed Cloud ServicesComments
No comments yet. Be the first to comment!