 Arjun Mehta
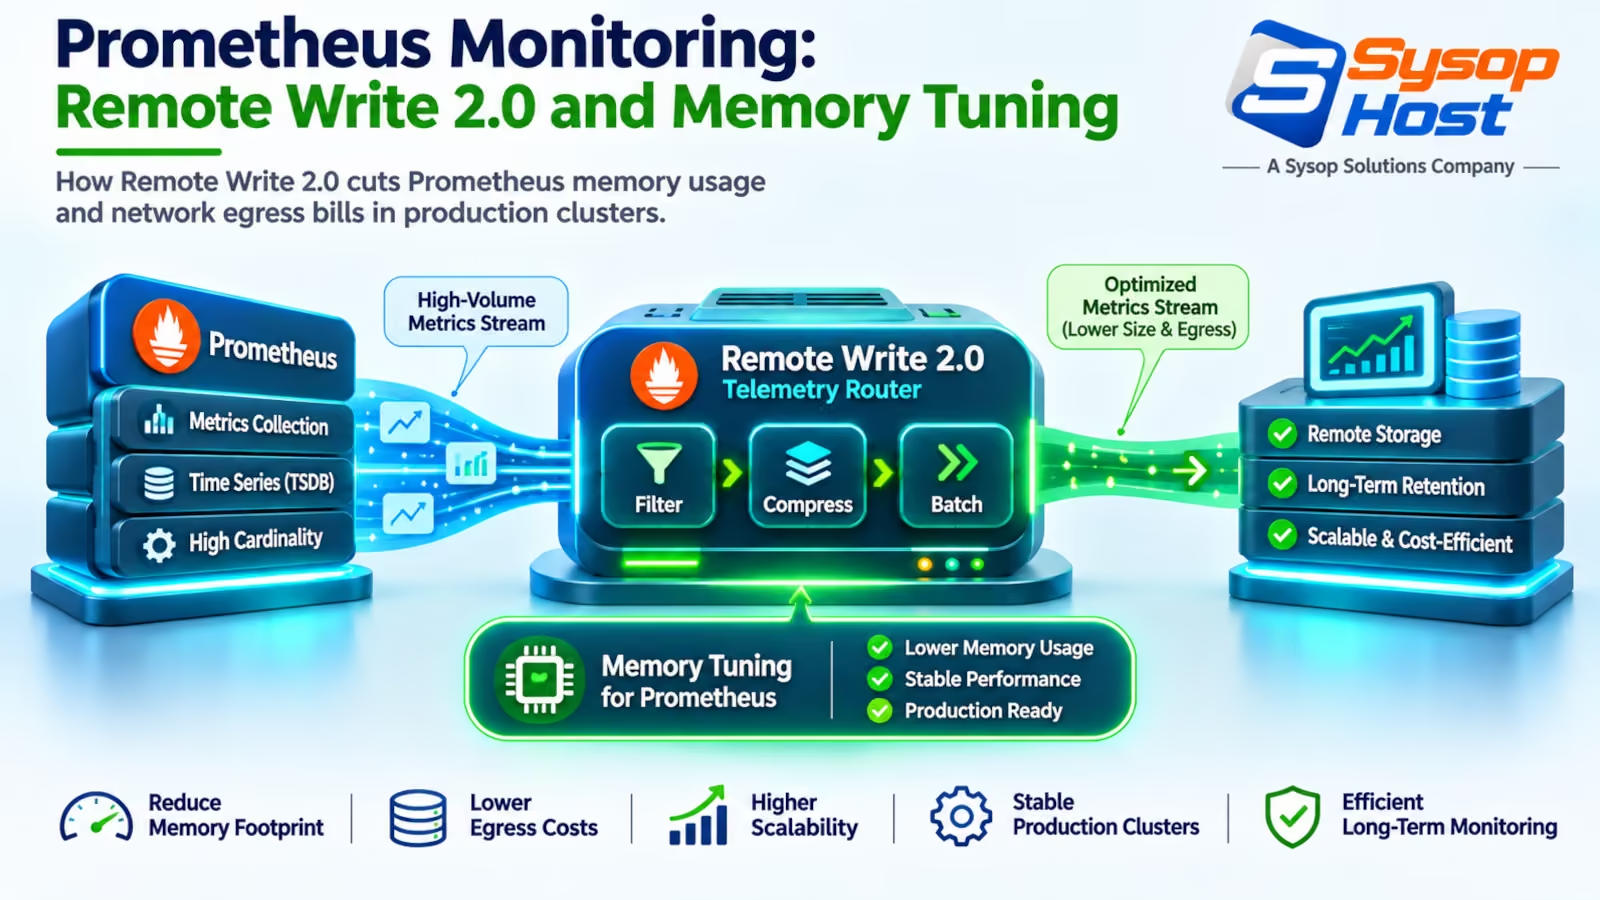
Prometheus 3.x changes the economics of remote telemetry. Remote Write 2.0 interns label strings into a shared symbol table and stops queue-induced memory spikes. Configure the protocol correctly, tune write-ahead log buffers, and prevent memory exhaustion across production scrapers.
Prometheus rarely dies of disk pressure. It dies of a slow receiver. The write queue backs up, chunks pile up in RAM, GC pauses stretch, and the kernel sends SIGKILL at the exact moment you need metrics most.
That is the tax prometheus monitoring at scale has always carried. Under Remote Write 1.0, shipping millions of series across regions burns gigabytes of RAM on the sending side and inflates the egress bill on the receiving side.
Prometheus 3.x changes that equation, but not the way the marketing suggests. Remote Write 2.0 replaces repeated label strings with a shared symbol table and lets native histograms travel as one series instead of forty buckets. Prometheus's own proposal measured payload reductions in the tens of percent on real workloads — the exact number depends entirely on how much duplication your labels carry [1]. The queue behaviour improves for a different reason: flat encoded bytes are cheaper for the garbage collector than expanded structs.
One caveat before you plan a migration: the 2.0 specification is still a release candidate. The message schema is stable enough to be worth adopting, and the receiver ecosystem supports it, but "experimental" means the wire contract can still move under you.
Where Remote Write 1.0 wasted memory and bandwidth
Remote Write 1.0 relied on protocol buffers (Protobuf) wrapped in Snappy compression. While functional, the schema suffered from three architectural inefficiencies:
Repeated string allocation: Every series in a batch sent string names and label names as complete, uncompressed literals within each sample group. If you scraped ten thousand Kubernetes pods reporting identical metric names with slightly varying pod IDs, Prometheus re-encoded the string bytes thousands of times per post request.
Batch-wide serialization locks: In version 1.0, the queue manager converted internal TSDB samples into Protobuf structs in heap memory before passing the slice to the compressor. During network slowdowns, thousands of serialized Go structs lingered on the heap, triggering massive memory bloat.
Absence of native histogram framing: High-resolution latency histograms required writing a distinct metric series for every single bucket boundary (
le="0.1",le="0.5",le="1.0"). Ten latency buckets multiplied series count tenfold before samples ever left the host.
These bottlenecks meant edge Prometheus scrapers often needed 16 GB to 32 GB of RAM purely to buffer transient network jitter to centralized storage systems like Grafana Mimir, Thanos, or VictoriaMetrics.
Remote Write 1.0:
[TSDB Samples] -> [Uncompressed Go Structs] -> [Protobuf Serialization] -> [Snappy] -> HTTP POST
(High heap retention during network latency)

Remote Write 2.0:
[TSDB Samples] -> [Shared String Symbol Table] -> [Snappy block] -> HTTP POST
(Up to 60% payload drop, zero redundant string allocations)
The wire mechanics of Remote Write 2.0
Remote Write 2.0 tackles serialization cost at the binary definition layer. The specification targets the root causes of telemetry bloat, which are string duplication and per-bucket series explosion [1].
String deduplication via symbol tables
Instead of repeating metric and label strings across every sample in a batch, Remote Write 2.0 introduces an indexed symbol table at the head of every payload. Each unique string (such as __name__, container_cpu_usage_seconds_total, or namespace) appears exactly once in the table. Individual time series records simply reference integer indices.
For workloads with high label cardinality, this string interning cuts raw uncompressed payload bytes by roughly 40% before compression even starts.
Compression: still Snappy, and why the savings come from elsewhere
This is where a lot of write-ups go wrong. Remote Write 2.0 does not add Zstandard. The specification still requires a Snappy-compressed protobuf body, and the zstd-scrape feature flag applies to scrape responses, not to remote write [1]. If you enable anything called "zstd" on the remote-write path, you're relying on a receiver extension that isn't in the spec.
So the payload reduction comes from the symbol table above, not from a better codec. A fat label set has more duplicate strings to collapse, so the saving scales with cardinality: a flat host-metrics scrape gains little, a 10,000-pod Kubernetes scrape gains a lot.
Native histograms add the second saving: one histogram payload replaces dozens of _bucket series, so there is less to compress in the first place.
For organizations shipping telemetry across AWS availability zones or out to remote data centers, that directly lowers egress invoices. When paired with Kubernetes FinOps strategies, telemetry egress drops from a major infrastructure expense into background noise.
Native histogram transmission
Remote Write 2.0 can carry Prometheus native histograms without expanding them into individual synthetic time series. A native histogram stores hundreds of sparse exponential buckets inside a single metric payload, so transmitting one series instead of forty classic _bucket series saves both Go allocations and wire bytes.
One detail that trips people up: this only happens if you set send_native_histograms: true on the remote_write block and the receiver accepts them. Leave it off and Prometheus sends classic buckets as before, which is why some teams "migrate to 2.0" and see almost no change.
Sizing queue buffers and Write-Ahead Log pools
Upgrading your Prometheus binary is half the work. If your queue settings remain tuned for version 1.0, your scraper will still over-allocate memory during network hiccups.
The queue manager in Prometheus maintains a set of concurrent shards that drain the local Write-Ahead Log (WAL) and send HTTP batches. Every shard allocates internal buffers. In version 3.x, you should tune these values explicitly in prometheus.yml:
remote_write:
  - url: "https://mimir.internal.net:8080/api/v1/push"
    name: "primary-cortex-backend"
    protobuf_message: "io.prometheus.write.v2.Request"
    send_native_histograms: true
    headers:
      X-Scope-OrgID: "production-fleet"
    queue_config:
      max_shards: 50
      min_shards: 4
      max_samples_per_send: 2000
      batch_send_deadline: 5s
      min_backoff: 100ms
      max_backoff: 10s
      capacity: 5000
    write_relabel_configs:
      - action: drop
        source_labels: [__name__]
        regex: "(container_tasks_state|apiserver_request_slo_duration_seconds_bucket)"
Let us dissect the load-bearing parameters:
protobuf_message: Setting this toio.prometheus.write.v2.Requestis what selects the 2.0 schema. The fully qualified name matters;prometheus.write.v2.Requestis rejected at config load.max_shards: Each active shard holds up tocapacitysamples in memory. In version 1.0, teams frequently setmax_shardsto 200 or 500 to keep up with ingestion spikes. With version 2.0, because batches contain more samples per compressed byte, shards drain faster. Lowermax_shardsto 30 or 50 to cap worst-case heap allocation.capacity: This defines the per-shard channel buffer. A value of 5,000 samples per shard provides sufficient resilience against short network pauses without hoarding hundreds of megabytes in the Go runtime.batch_send_deadline: A 5-second deadline ensures that even low-traffic metrics batch efficiently, maximizing symbol table deduplication before dispatch.
What actually changes in the heap under backpressure
We're not going to print a benchmark table for a cluster we didn't run. The honest version is a mechanism table: what the protocol change does to each pool, and why.
Resource | Remote Write 1.0 | Remote Write 2.0 | Direction |
|---|---|---|---|
Wire bytes per batch | Every label string repeated per series | One symbol table per request | Sharply down, more so as cardinality rises |
Queue buffer contents | Serialized protobuf structs held on the Go heap | Encoded bytes held in the queue | Down, and cheaper for GC to scan |
Series count for a histogram | One series per bucket boundary | One series per histogram | Down by the bucket count |
Local disk, TSDB head, query RAM | Unchanged | Unchanged | Flat |
Prefill/CPU per sample | Baseline | Slightly higher to build the symbol table | Slightly up |
The row that matters for OOM kills is the second. When a downstream endpoint slows down, Remote Write 1.0 keeps fully expanded structs alive on the heap, each with pointers into string data, so the garbage collector has to walk all of it. Remote Write 2.0 keeps flat encoded buffers. Same number of bytes, far less pointer chasing, which is why the pause times improve even when the volume doesn't fall much.
The last row is the one vendors skip: interning costs CPU. On a scraper already pinned at its core limit, 2.0 can make things slightly worse. Measure before you assume.
If your Prometheus instances run alongside other production containers, preventing these unexpected memory spikes protects your whole node. For critical installations, running dedicated monitoring on managed cloud infrastructure or isolated bare metal provides clean resource boundaries.
Safe migration blueprint: zero metric loss
Migrating an established observability pipeline requires caution. If your receiver doesn't support Remote Write 2.0 yet, flipping the flag will drop batches or fail outright.
Follow this phased checklist:
Phase 1: Receiver Compatibility Check
Verify Mimir (>= 2.13), VictoriaMetrics (>= 1.102), or Thanos (>= 0.36) support for Write v2.
       │
Phase 2: Dual-Write Canary
Configure a secondary remote_write block with Write v2 targeting a staging receiver.
       │
Phase 3: Verify Sample Continuity
Compare query counts: sum(rate(scrape_samples_scraped[5m])) vs remote ingestion rates.
       │
Phase 4: Cutover Primary
Switch primary block to prometheus.write.v2.Request and decommission canary block.
Step 1: Verify receiver capability
Confirm your backend collector accepts version 2.0 requests. Recent builds of Grafana Mimir, VictoriaMetrics, and Thanos Receiver support Write v2 natively [4]. If you route metrics through an intermediary gateway or proxy, ensure it does not strip the Content-Type: application/x-protobuf;proto=io.prometheus.write.v2.Request header.
Step 2: Establish a canary remote write block
Before modifying your primary remote write configuration, add a secondary canary destination in Prometheus pointing to your updated endpoint:
remote_write:
  - url: "https://metrics-receiver.internal/api/v1/write"
    name: "legacy-v1-primary"
    # Existing 1.0 configuration continues undisturbed

  - url: "https://metrics-receiver.internal/api/v2/write"
    name: "canary-v2-test"
    protobuf_message: "io.prometheus.write.v2.Request"
    queue_config:
      max_shards: 4
      capacity: 1000
    write_relabel_configs:
      - action: keep
        source_labels: [job]
        regex: "node-exporter"
Step 3: Monitor scraper error metrics
Watch the internal metric prometheus_remote_storage_samples_failed_total. If this counter climbs on your canary pipeline, examine the HTTP response code returned by the storage backend:
HTTP 415 (Unsupported Media Type): The receiver does not understand the 2.0 Protobuf schema. Upgrade the ingestion gateway.
HTTP 400 (Bad Request): Indicates an issue with symbol table decoding or unsupported native histogram data.
HTTP 429 (Too Many Requests): Downstream rate limits hit. Because version 2.0 sends larger numbers of samples inside fewer network requests, adjust downstream sample rate throttles rather than connection throttles.
Once the canary operates cleanly for 24 hours with matching query results, switch your primary pipeline to version 2.0 and remove the legacy block.
Metric dropping: the fastest way to save memory
Protocol upgrades save bandwidth, but collecting useless metrics remains the primary reason Prometheus runs short of RAM. No amount of compression fixes labels that change on every HTTP request.
Review your scrape configs for high-churn metadata. The most frequent culprits in cloud environments are:
Client IP addresses inside labels: Storing ephemeral IPs in metric labels turns Prometheus into an access log, creating millions of short-lived series.
Ephemeral container IDs: Pod restart loops that append random container hashes to time series rapidly exhaust memory index buffers.
Unused API server histograms: Kubernetes API servers emit detailed duration buckets for health checks and controller reconcile loops that operators rarely query.
Use metric_relabel_configs on your scrape jobs to drop noisy series before they touch the local storage engine:
scrape_configs:
  - job_name: "kubernetes-pods"
    kubernetes_sd_configs:
      - role: pod
    metric_relabel_configs:
      - action: drop
        source_labels: [__name__]
        regex: "(http_request_duration_seconds_bucket|rest_client_request_duration_seconds_bucket)"
      - action: labeldrop
        regex: "(pod_template_hash|controller_revision_hash)"
Stripping these high-cardinality attributes keeps your active series count stable, ensuring that Remote Write 2.0 operates on clean, high-value metrics. For organizations operating sprawling clusters, our team provides architectural guidance through Kubernetes and EKS consulting.
Who should stay on Remote Write 1.0
Remote Write 2.0 is a clear improvement for cloud-native infrastructure, but it isn't mandatory for every install.
Keep version 1.0 if you operate within these parameters:
Legacy ingestion proxies: If your metrics traverse corporate security middleboxes that inspect raw Snappy streams or enforce strict HTTP/1.1 payload inspections, updating the middlebox firmware must happen first.
Static low-volume edge appliances: A single dedicated server tracking fifty metrics on an internal network uses negligible bandwidth. The engineering time to test and validate version 2.0 cutover will exceed any compute savings.
Unmanaged third-party SaaS endpoints: If your metrics provider has not documented support for
prometheus.write.v2.Request, forcing the flag will result in silent dropped batches or HTTP 400 errors.
For modern infrastructure shipping millions of samples across VPC boundaries, adopting Remote Write 2.0 is one of the highest-return configuration changes available. Combine it with disciplined label scrubbing and appropriate buffer pool sizing to keep your monitoring reliable through the largest traffic spikes.
Build resilient monitoring without runaway memory bills
SysopHost cloud servers provide dedicated NVMe storage, unmetered network interfaces, and 24/7 engineer support to run Prometheus and OpenTelemetry fleets that never crash during an incident.
Explore Infrastructure MonitoringComments
No comments yet. Be the first to comment!