 Neha Sharma
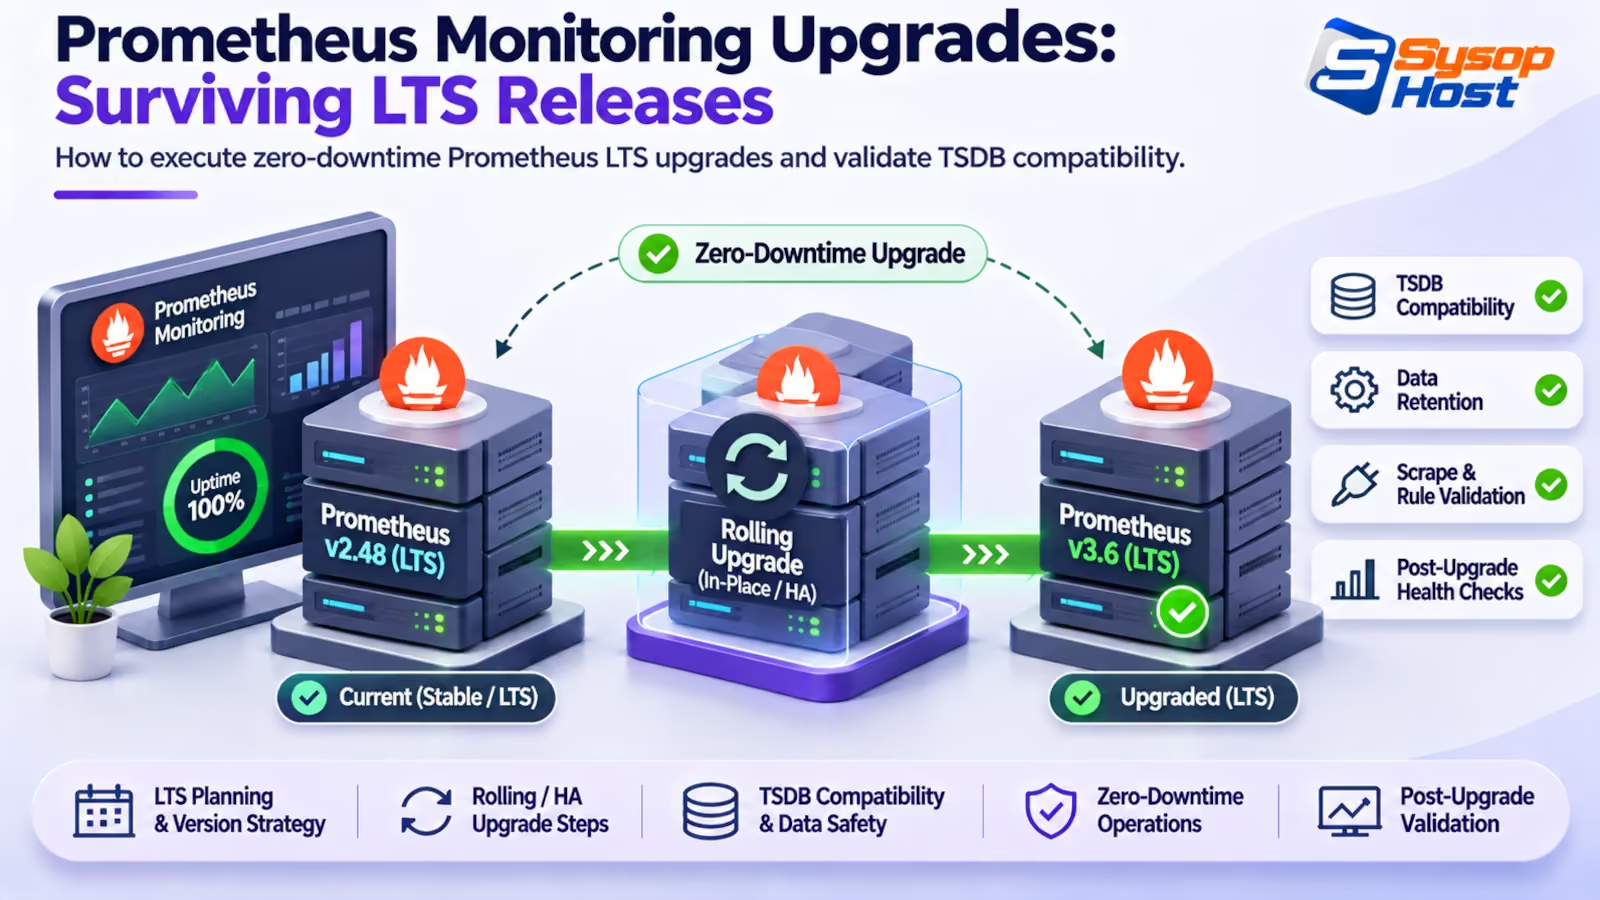
Managing telemetry across enterprise infrastructure requires predictable upgrade paths. The formal Prometheus Long-Term Support cadence guarantees twelve months of critical patches. This guide details how to plan production upgrades, validate storage compatibility, and execute zero-downtime rolling cutovers.
An operations team maintaining sixty Kubernetes clusters does not fear application deployments. They fear monitoring upgrades. When an infrastructure engineer bumps a Prometheus minor release and the scraper fails to replay its Write-Ahead Log, alerts go blind across the entire fleet within minutes.
Treat the observability stack like a production database. Prometheus monitoring upgrades touch storage format, query parsing and alert routing, and none of those roll back cleanly. Upgrading Prometheus isn't just a container tag bump. It involves storage format transitions, PromQL parser adjustments, and Alertmanager API migrations.
With the establishment of the Prometheus Long-Term Support (LTS) release program, platform teams gain a stable foundation [1]. Instead of chasing rapid six-week minor iterations, enterprises can pin infrastructure to a designated LTS version, the first being 3.5, which receives critical security fixes and severe bug backports for twelve consecutive months. Adopting this schedule minimizes unplanned maintenance while ensuring your monitoring remains secure.
The mechanics of the Prometheus LTS policy
Prior to the LTS framework, keeping Prometheus current felt like running on a treadmill. Security vulnerability disclosures (CVEs) and high-severity defects were typically patched only in the newest minor release. An organization running version 2.45 had to choose between jumping forward several feature releases or accepting known security risks.
The LTS governance model establishes clear commitments:
Predictable annual cadence: A designated minor release is declared an LTS branch roughly once per year.
Twelve months of critical backports: Any security vulnerability with a CVSS score of 7.0 or greater receives backported patches directly to active LTS branches [1].
Severe regression fixes: Bugs causing data corruption, persistent crash loops, or metric collection failure are backported without pulling in risky new feature sets.
Guaranteed upgrade path: Consecutive LTS versions are tested specifically for direct forward migration, ensuring that the TSDB on disk loads cleanly across LTS boundaries.
This structure allows platform engineers to schedule upgrades during deliberate maintenance windows rather than executing emergency version bumps under pressure.
Community Releases:  v3.0 -> v3.1 -> v3.2 -> v3.3 -> v3.4 -> [v3.5 LTS] -> v3.6 -> ...
Support Window:       |--- 6-week active maintenance ---|   |--- 12 Months Critical Security/Bug Backports ---|
Critical architectural shifts in Prometheus 3.x
Teams transitioning from legacy 2.x releases into the modern 3.x LTS stream must accommodate several breaking changes in system defaults.
Alertmanager v2 is now mandatory
Prometheus 3.x completely removes code paths for the legacy Alertmanager v1 API. If your prometheus.yml contains an alerting block that relies on v1 paths, Prometheus will fail startup validation:
# Incompatible legacy configuration:
alerting:
  alertmanagers:
    - scheme: http
      path_prefix: /api/v1  # Fails in Prometheus 3.x

# Required modern configuration:
alerting:
  alertmanagers:
    - scheme: http
      api_version: v2
      static_configs:
        - targets: ["alertmanager.monitoring.svc:9093"]
Alertmanager v2 uses standard structured JSON and supports high-availability alert deduplication natively. Ensure your Alertmanager cluster is running version 0.27 or higher before updating your Prometheus scrapers [2].
Default UTF-8 metric and label encoding
Historically, Prometheus enforced strict ASCII alphanumeric rules for metric and label names. Any dot, dash, or slash was rejected during scrape ingestion. Prometheus 3.x enables full UTF-8 support by default. While this allows direct alignment with OpenTelemetry semantic conventions (like http.response.status_code), it can catch older downstream alerting templates and dashboard variables off guard.
If your Grafana dashboards use regular expression extractors that assume metric names match [a-zA-Z_:][a-zA-Z0-9_:]*, verify those regex patterns prior to upgrading.
Native histograms are still experimental
Don't let a 3.x version number fool you: native histograms remain an experimental feature. Scraping them requires scrape_native_histograms: true on the scrape config or the --enable-feature=native-histograms flag, and the storage encodings they use are still moving. The histograms-st-encoding flag is explicitly one-way: blocks written with it cannot be read by older binaries, and in some combinations cannot be read by the version that wrote them. Treat enabling it as a migration, not a toggle.
The practical rule for an LTS upgrade: leave native histograms off unless you have a downstream store that you have tested end to end, and never enable the start-timestamp histogram encodings on a cluster you might need to roll back.
Pre-upgrade validation: storage and rules
A reliable upgrade begins long before touching container manifests. Two specific areas require validation: the local TSDB files on disk and the syntax of active alerting rules.
Checking TSDB block consistency
Prometheus writes incoming metrics to a memory-mapped Head block, flushing two-hour blocks to disk alongside a binary index. A hard power failure or sudden pod eviction can leave trailing fragments. While Prometheus normally repairs these on startup, passing damaged blocks through a major version upgrade risks extended repair times that prolong downtime.
Run promtool tsdb analyze against your persistent volume before initiating the upgrade:
# Analyze storage blocks on disk before running the upgrade
promtool tsdb analyze /var/prometheus/data

# Expected clean output: per-block IDs and durations, a series and
# sample count, and the highest-cardinality label names. Any "corrupted"
# or "unexpected" line means stop and repair before upgrading.
If the command reports corrupted chunks or broken chunk references, execute a repair pass using promtool tsdb dump or allow the current version to finish its compaction cycle cleanly before stopping the service.
Rule and configuration linting
PromQL parser updates in version 3.x enforce stricter syntax around scalar evaluations and label matching. Run promtool check against your configuration and rule files using the target binary version:
# Verify prometheus configuration syntax
docker run --rm -v $(pwd)/config:/etc/prometheus prom/prometheus:v3.5.0 \
  promtool check config /etc/prometheus/prometheus.yml

# Verify alerting and recording rules
docker run --rm -v $(pwd)/rules:/etc/prometheus/rules prom/prometheus:v3.5.0 \
  promtool check rules /etc/prometheus/rules/*.yml
Pay attention to deprecated duration suffixes and ambiguous PromQL expressions that return warnings. In Prometheus 3.x, several expressions that previously returned warnings now produce fatal configuration errors.
Zero-downtime rolling cutover patterns
In production you can't just stop Prometheus, snapshot the volume, swap the image and start it again. That creates a blind spot in cluster monitoring.
Production deployments achieve zero downtime using dual-collector redundancy or rolling stateful updates.
Step 1: Scraper Pair A & B running current LTS (v3.5)
[Scraper A (v3.5)] ---> Ingesting Targets
[Scraper B (v3.5)] ---> Ingesting Targets

Step 2: Upgrade Canary (Scraper B upgraded to v3.13)
[Scraper A (v3.5)] ---> Active Alerting & Dashboards
[Scraper B (v3.13)] ---> Validating Scrape Success & Rule Timing

Step 3: Cutover Complete (Scraper A upgraded to v3.13)
[Scraper A (v3.13)] ---> Upgraded & Healthy
[Scraper B (v3.13)] ---> Upgraded & Healthy
The dual-collector pair pattern
Running pairs of identical Prometheus instances scraping the same targets is standard practice for high-availability observability. Alertmanager handles alert deduplication, while Grafana can load-balance queries between both instances.
Silence alerts on Instance B: Place a maintenance silence on the secondary scraper in your routing layer or temporarily configure Alertmanager to ignore alerts from its cluster label.
Apply the LTS update to Instance B: Update the container image or package binary.
Monitor WAL replay: Watch
prometheus_tsdb_wal_replay_duration_seconds. Depending on the volume size, replaying uncompacted WAL segments can take anywhere from thirty seconds to several minutes.Validate scrape continuity: Compare the metric
prometheus_target_interval_length_secondsbetween Instance A and Instance B. Ensure scrape durations remain stable.Switch query traffic: Direct dashboard traffic to Instance B. Once satisfied, apply the upgrade to Instance A.
This procedure guarantees continuous metric collection throughout the maintenance window. If your team operates dedicated infrastructure without container orchestrators, deploying on reliable dedicated server hosting ensures high disk I/O during WAL replay phases.
Post-upgrade verification matrix
Once the updated binary is running, verify system health using the internal metrics Prometheus exposes about itself:
Verification Metric | Expected Threshold | Diagnostic Meaning |
|---|---|---|
| Must equal | Any non-zero value indicates unreadable WAL records on disk. |
| Must equal | Alerts or recording rules are failing execution due to syntax changes. |
| Must equal | Target discovery blocks failed to initialize. |
| Within 10% of baseline | Highlights query engine degradation or index lock contention. |
| Stable after 2 hours | Checks for memory leaks in updated scraper components. |
Keep both instances running for at least two complete two-hour block compaction cycles before declaring the upgrade complete. Compaction triggers the most disk-intensive and CPU-intensive operations in the TSDB engine.
Rollback strategy: protecting write state
Every upgrade plan must contain a viable rollback procedure. If an upgraded instance exhibits memory instability or unexpected query failures after two hours of operation, how do you revert safely?
The primary operational risk during a rollback is TSDB block format incompatibility. Prometheus binaries are strictly forward-compatible regarding storage: version 3.x can read blocks written by version 2.x, but version 2.x cannot read blocks created by 3.x if new index features (such as UTF-8 or native histogram postings) were committed to disk.
Follow these rules for safe rollbacks:
Never roll back in-place against modified storage: If you must revert to an earlier major version, do not point the old binary at a data directory that an updated version ran against for multiple hours.
Rely on snapshot restoration: Take a storage snapshot prior to starting the upgrade. If a rollback is triggered, restore the storage snapshot rather than forcing the older binary to parse new blocks.
Fail over to the secondary scraper: In a high-availability pair, if Instance B fails post-upgrade, do not attempt immediate in-place repair. Simply terminate Instance B, provision a fresh instance running the proven version, and allow it to populate a fresh local TSDB while Instance A continues serving traffic.
Managing multi-cluster observability fleets and executing reliable version upgrades requires deep operational discipline. If your team prefers to focus on building software rather than managing storage volumes and alerting pipelines, our engineers provide fully managed solutions through infrastructure monitoring services and DevOps consulting.
Infrastructure monitoring managed by engineers, not ticket bots
SysopHost provides dedicated cloud servers, high-throughput NVMe storage, and 24/7 engineer support to ensure your Prometheus and OpenTelemetry fleets remain reliable and current.
Explore Managed MonitoringComments
No comments yet. Be the first to comment!